
Mise En Place
They say that 80% of analysis is the prep: gathering and manipulating data in a place where it’s somewhat digestible. Until working on our first project for Metis, I hadn’t grasped that 80% of the frustration would come from come from cleanup as well.
I was thrown into the fires our first week at Metis and tasked with leveraging MTA subway data to isolate the best areas to solicit emails for a fake non-profit. Beyond fictitious charities, understanding transit concentrations has huge practical applications from advertising deployment to real estate pricing, so I was pretty excited to start off with a realistic professional scenario.
First I needed to understand the raw materials.
One of the most important stages in cooking is creating the mise en place. The Mise en place, or things in place, is the preparation and organization of all the ingredients before any of the cooking is done. One of the biggest ways a home chef can cook faster and more efficiently is by doing the mise every time. You simply waste more energy if you have to shuffle back and forth between the knife and the pan. TV chefs like Martha and Emeril have aids to do all the prep, so they look like experts when picking up and dumping in the pre-portioned ingredients at every stage. I knew I needed to slice, dice, and massage the data myself.
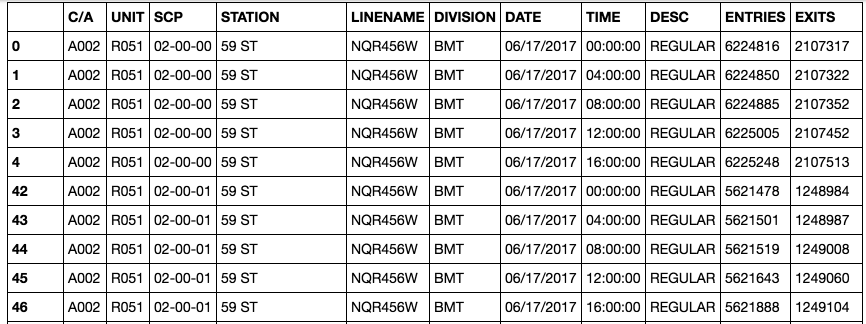
Understanding The Raw Materials: Broken out by week and going all the way back to 2010, the data is easily accessible via the MTA website. Yet inspecting the data a little bit further and you see a couple of issues:
Needless Granularity: The set is broken out into Control Area (C/A), Unit, Subunit Channel Position (SCP), Station, and Line Name to detail out the activity for every machine in the system on a 4 hour interval. Unless I could position solicitors by a cluster of machines within a subway station, which would require corresponding the SCPs with station maps, most of these datapoints were unnecessary. In the compost pile they go.
Cumulative Counts: For some reason the MTA decided that tracking the running counts for entries and exits was the best method possible, maybe to easily adjust for audits and retroactive corrections. Finding the entries and exits within a period of time required some basic arithmetic - not a difficult task. However, this led to some complications including…
Decreasing Counts: While most of the data listed cumulative counts for entry and exit data, some periods successively decreased for specific stations.
Random(?) Resets: Turnstiles can’t just keep adding up - given that the MTA is over 60 years old with millions of riders weekly, the number would be huge if it never reset! Whether the numbers reset at a specific time or a threshold would affect the data analysis.
Miscellaneous: On top of everything, some other inconsistencies I encountered with the data included but were not limited to:
*Inconsistent Linenames - Some stations had Lines LNQR456W and 456LNQRW, which is an obvious technical error.
*Inconsistent time slices - Some of the 4 hour periods started at midnight for a day, others started at 1 or 2AM.
*Too Many 1st Ave Subways! - Grouping just the station would cause stations of the same name, but in different boroughs, to be lumped in together.
So what does the data look like when imported into the system? UGLY. Adjusting for the running counts, we see that some negative values cause massive drops (fangs?) in the system data.
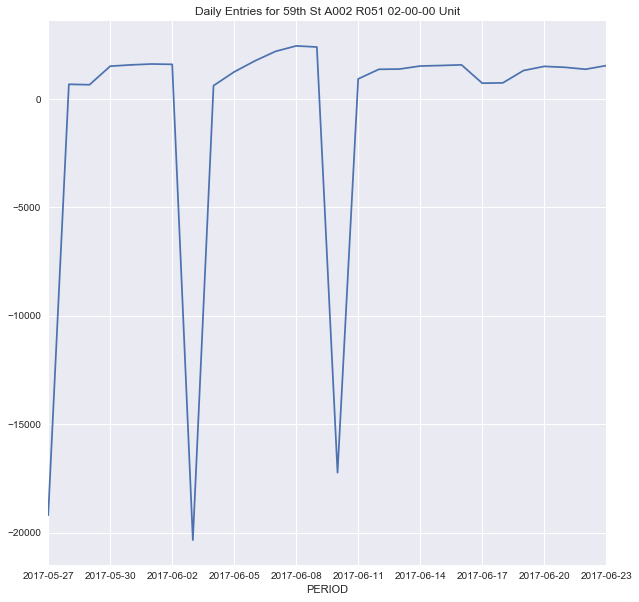
These datapoints occurred repeatedly in the same time period (Saturday at midnight) so I suspected these were due to data resets. Into the trash they go. I took the absolute value for the rest of the negative values to preserve the data since they looked like an accidental negative counter.
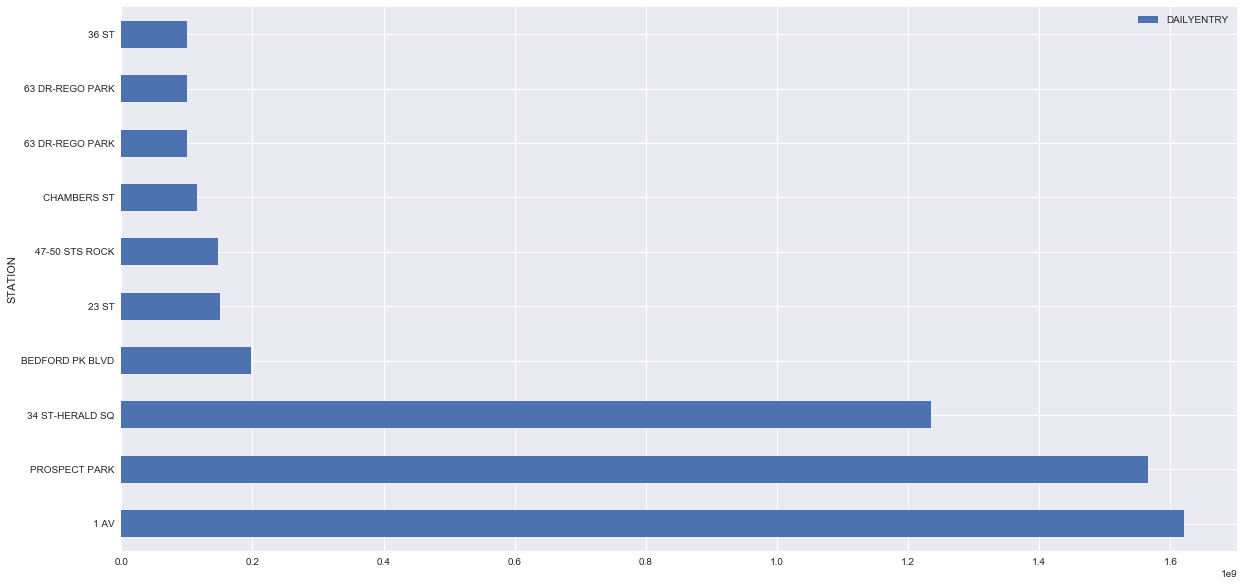
In addition, I found some values to be IMPOSSIBLY large. Unless 1 billion people suddenly went through Prospect Park, these values were obviously wrong. Since these were less than 1% of the values, they went into the trash.
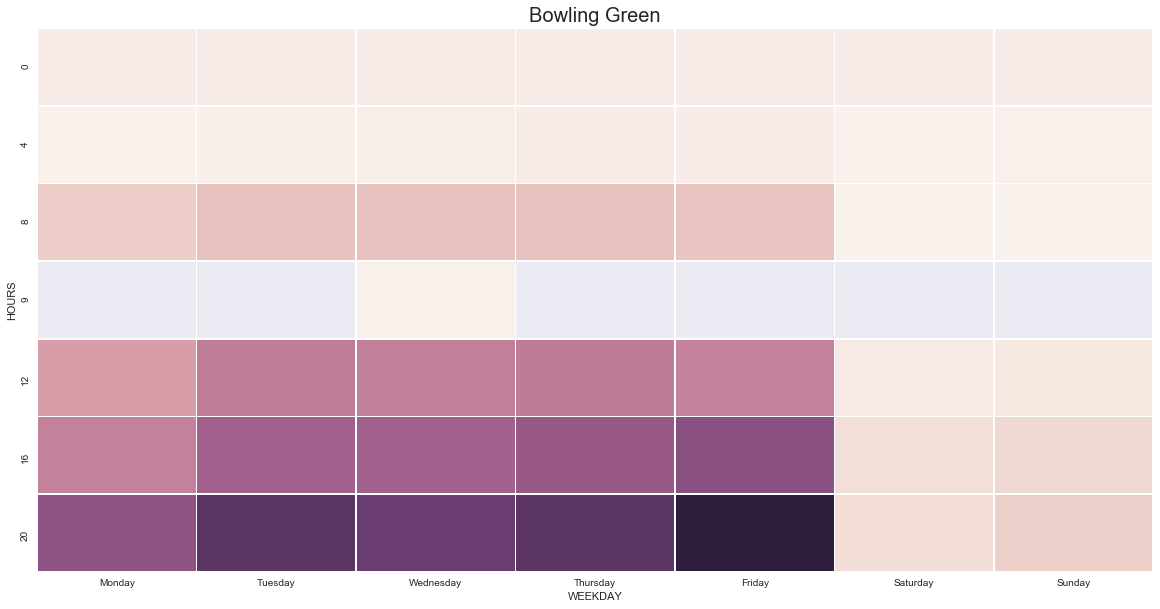
All of this cleanup was necessary to get the data to a place where things looked realistic and eventually I could plot it out into something like this.
Now we’re cooking! Part 2 to come.